Pie chart is circular statistical graphical representation of data, which is divided into sectors of circle to illustrate numerical proportion. here each sector represents data about a given particular category. The sector of circle are constructed in such a way that the area of sector is proportional to the corresponding value of given data and that area intern depends upon angle of sector which interns proportional to the data given.In pie chart the total quantity is distributed over an angle of 360 degree that is 100%.
Since the area of sector is proportional to the corresponding value of components and their ratio will becomes equal.
Let us solve one problem- In a class there are 90 students from which 20 are interested in science only, 10 are interested in mathematics only, 12 are interested in sports only, 16 are interested in social studies only, 8 are in languages only and remaining interested in cultural activities only. Draw pie chart for given information.
Solution:1st we will make the table and then we will draw the pie chart after filling of table

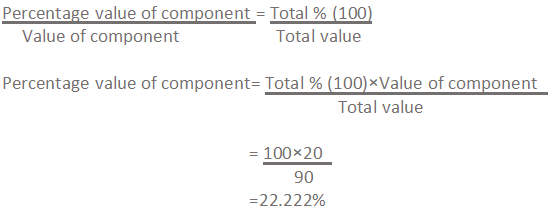
1st we will find angle and % correspond to who interested in science
We know,
Here we need to find the center angle of component i.e

Here the value of component means number of students who interested in science i.e 20
Then,

In the same way we will find percentage also. Here we will slightly alter the formula.

Then the table will become

In same way we will perform all the calculation. After filling all the the data finally the table will becomes,


Comments
Post a Comment